
Optimization by taco, part II
Is the artisanal guac slowing us down?

Our last trip through the taco stand had us using Little’s Law as a lens to understand how to organize a super-efficient taco restaurant (and really, a more efficient anything). But even in a world with delicious tacos, our systems aren’t always perfect. So let’s look at what happens when Little’s law breaks down—when arrival and service times vary, and we can’t rely on averages anymore.
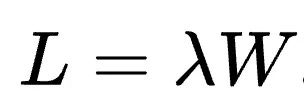
As a quick refresher, Little’s law is a formula that relates the long-term average arrival rate, wait time, and queue length for taco restaurants—or any other kind of queueing system. In the equation, L is the number of items in the queue, lambda is the average arrival rate, and W is the average amount of time an item is in the system:
The law is super useful to answer questions like:
If it takes three minutes, on average, to make a taco and there are 10 people in line, will we miss our train if we stop to eat?
If the restaurant tends to get about 10 new customers per hour, how big does the restaurant need to be?
The reason we can use Little’s law to answer these questions is because we’re assuming that the long term behavior of the system (the mean) is actually a good guide for the behavior of the system at any given point in time.
However, as anyone who’s shown up to a popular restaurant during a lunch rush, or gotten the new trainee who’s just learning the register knows, that’s not always the case. The line snakes out the door and your order takes forever.
The key to wrapping our equations around these moments is to understand that, rather than being a single, fixed value, both service time and arrival rate are variables that change over time. I like to imagine them both as little black boxes that spit out slightly randomized values every time.
There are a host of reasons for this randomization, from individual people getting tired, to machines breaking, and customers showing up in large groups. In the end, it’s people doing people-stuff with things other people built—there’s bound to be tons of wobble everywhere.
So, rather than just looking at the average over time, we’re going to want to look at arrival rate and service time as distributions.
Distributions: A bit of math via pictures
To understand what I mean by a distribution, it’s useful to think a bit about measuring events. This may be familiar to some folks, so feel free to skip ahead. But if you don't know what the word "variance" means, you might want to stick around.
To start, assume that we stood inside the taco restaurant with a stopwatch and measured how long it took for each taco to be made. (Further, assume they didn’t call the cops because we seemed like giant weirdos standing there with a stopwatch.) Then we made a histogram showing the distribution of those times—how many times it took three minutes versus four minutes to make a taco. That might look something like this:
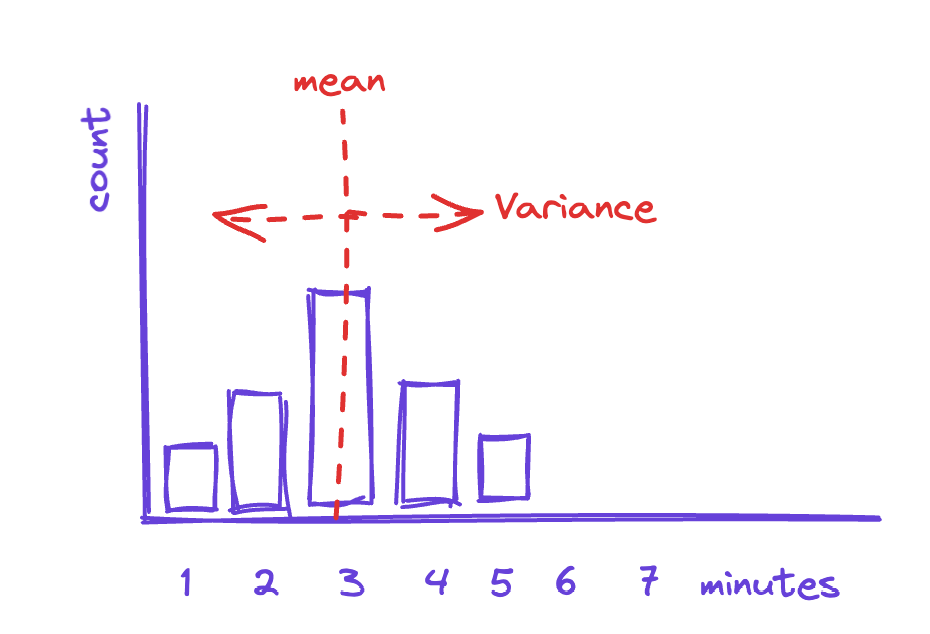
This shows us that, on average, each taco takes about three minutes to make, with some of them taking slightly longer (maybe our taco maker dropped the sour cream gun or had to run to the back for more cheese), and some of them taking less time (our taco expert was really on a roll).
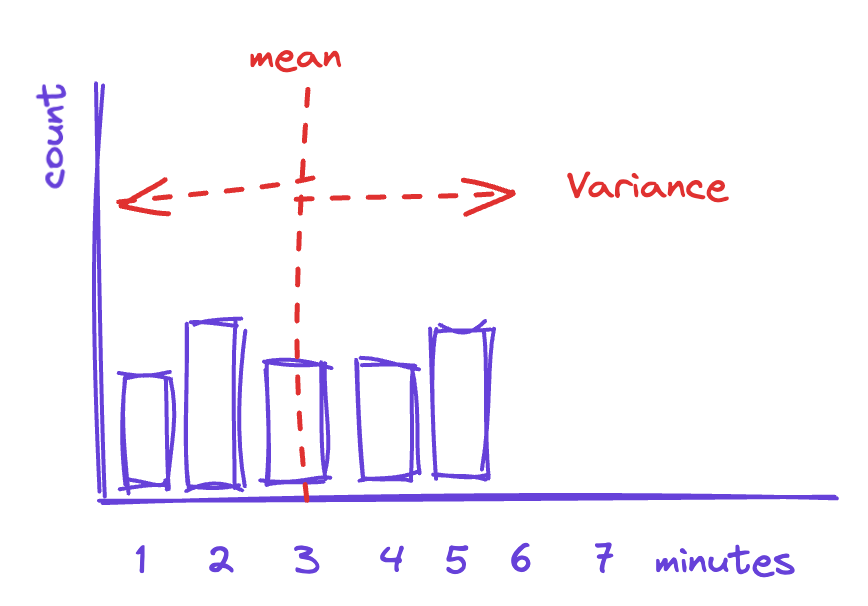
Variance, then, is the measure of how spread out this distribution is. The more spread out, the more variance there is in our process and the less instructive the mean is. A wide spread in distribution means that long-term behavior is less likely to be a good guide for the short-term situation.
For example, if the distribution looks like the one below, then using three minutes as the value for taco prep time is not significantly more valid than using four minutes.
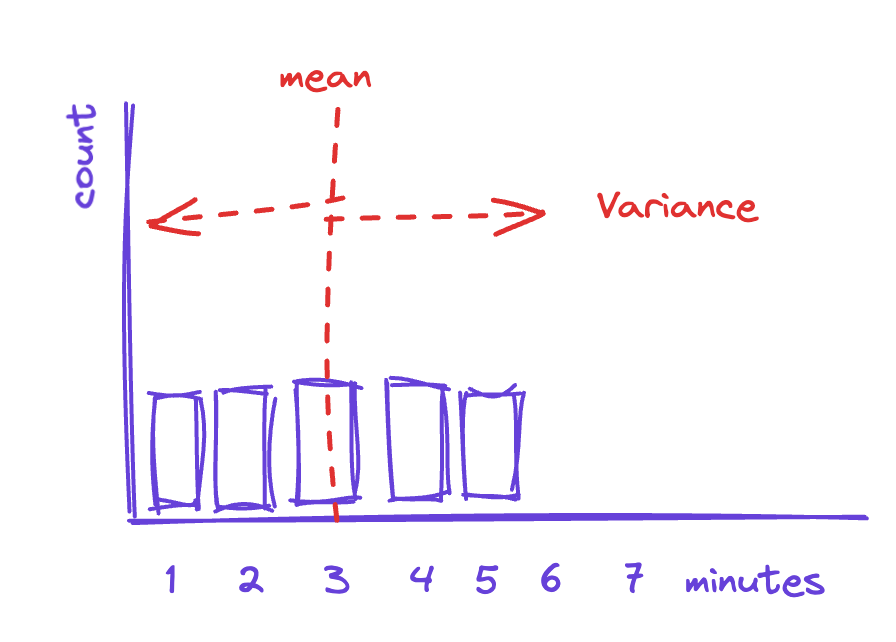
In the graph above, there doesn't seem to be such a thing as an "average" taco—each one is a journey of discovery (perhaps they are artisanal tacos?).
It turns out that looking at these distributions is hugely helpful if we’re trying to understand our process and potentially make it more efficient and predictable.
[Note: To make the implicit point more explicit, and to assuage any readers who may be fans of Six Sigma, in general, we’re trying to remove variance from our processes. That is, we’d be happier if the graphs were less like distributions and more like a single value—it’s easier to predict and, as I’ll show later, it actually turns out to be more efficient.]
Distributions: Bactrian vs. dromedary
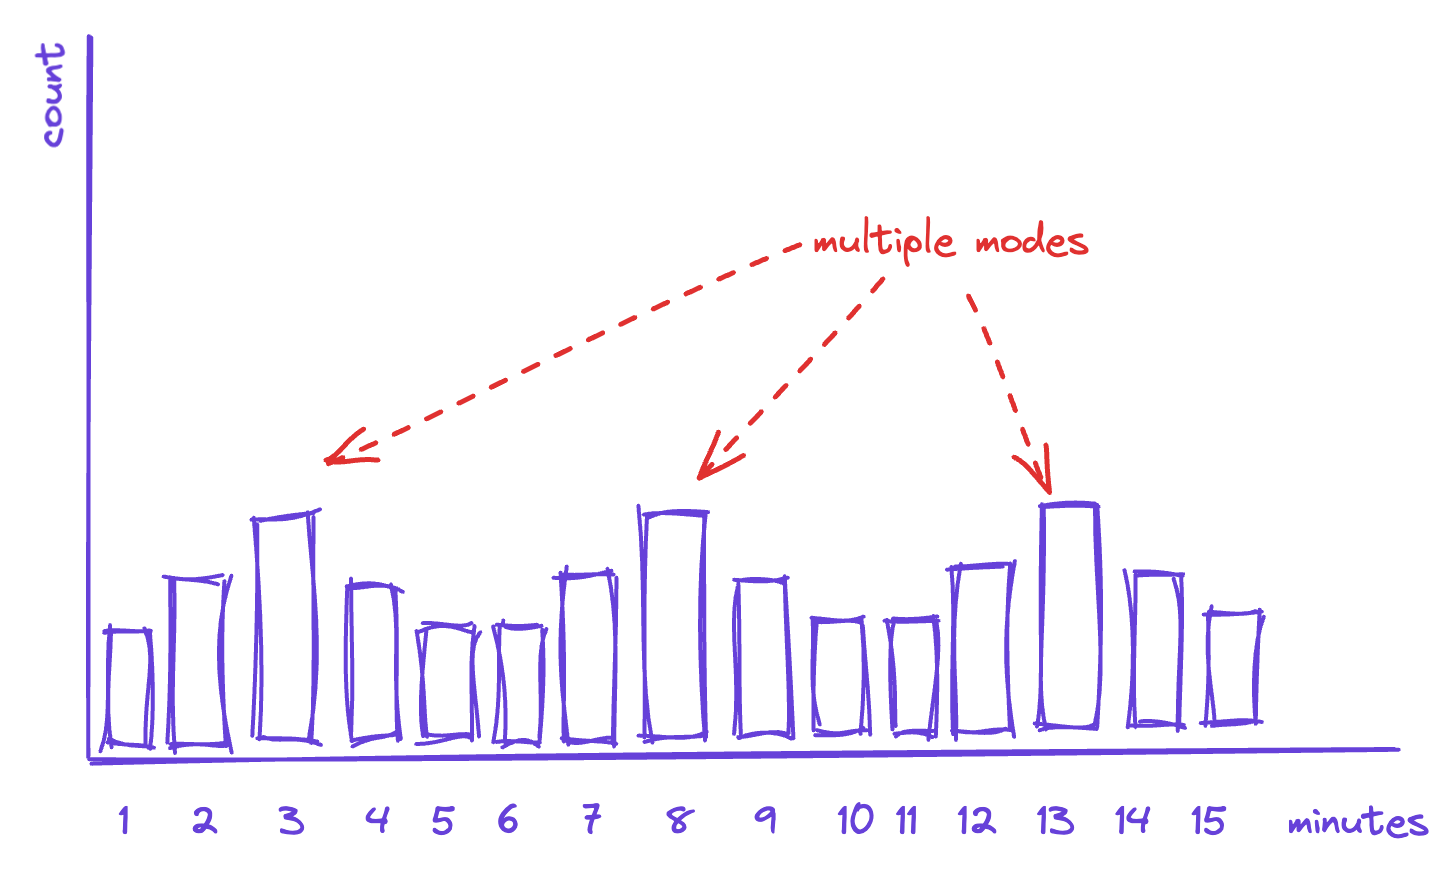
Like camels, distributions can have more than one “hump” (if we’re fancy, we can call them modes). This happens when there is more than one value that is really common. While the distribution will still have a single mean, that mean will be much less descriptive of what’s actually going on. In fact, a multi-modal distribution tends to indicate that you actually have more than one process at work, and you may be mistakenly measuring it as a single thing.
In the graph below, for instance, the three humps for taco prep time seems to indicate we actually might be seeing the impact of having three different types of taco on the menu, each of which takes a slightly different time to prepare:
If we’re trying to squeeze the variance out of a process like this, we would do well to try to understand the commonalities of jobs in each of these modes, and how they’re distinct from jobs in the other modes.
So, if we discover that the type of taco is a good indicator of which mode the prep time will fall into, then we can decide to reduce the service-time variance by splitting the preparation of tacos into different stations, so each station has a more well-behaved mean.
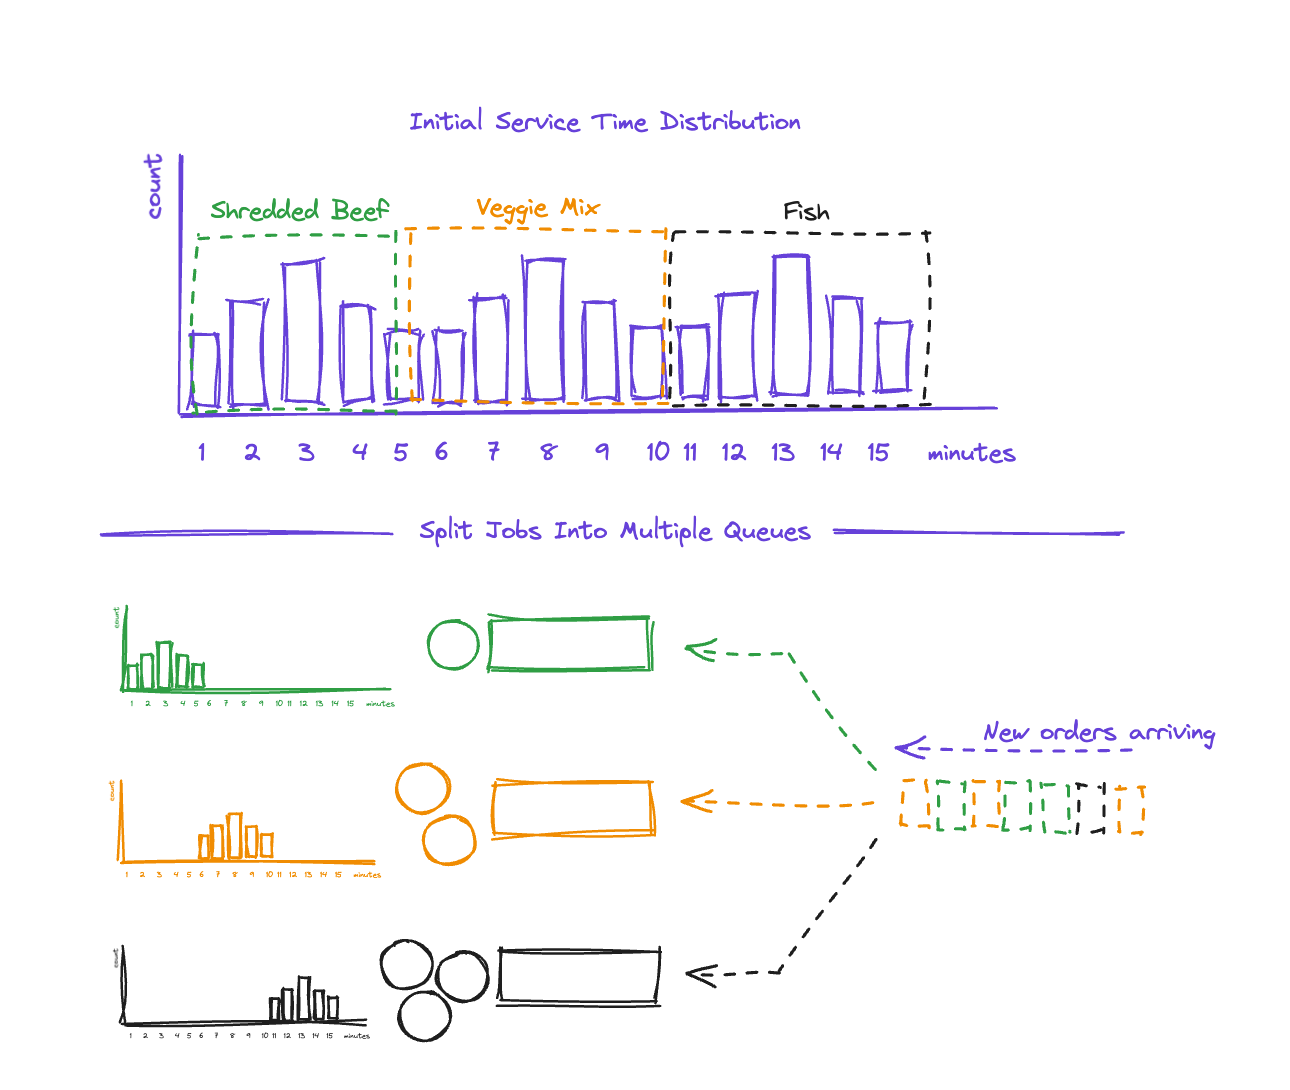
The diagram above shows what this might look like. The three modes correspond to different taco types, so we divide the work into three separate queues based on that. Each queue will now have a much more well behaved service time distribution.
Note that splitting the work does not make the work magically faster. In this case, fish tacos still take longer to prepare. However, in the new system we can compensate by having more people staffing that queue.
This is a common pattern you see in the real world all the time—it’s why we have express checkout lanes, credit card-only cashiers, and TSA PreCheck.
Distributions: Mean?!? What mean?!?
Returning to our spread-out example, if your mean looks like the one below, then what you’re looking at is a process that’s not really well behaved because each job seems to be fundamentally different:
This could be the result of several things. A couple of them are:
Poor definition: In this case, the job times are different because the jobs themselves are radically different. This happens when your menu is too large, or you allow too much customization in a product, or your master service agreement (MSA) is too loose for your service. In this case, your team can’t rely on consistent methods and muscle memory. The fix here is to change the menu. Identify workflows and cases you will handle, and discard the rest.
Training gaps: Here the jobs are not actually different, but the team lacks standard procedures or training, so employees are figuring it out as they go, and that takes different lengths of time. This is what you see when you have a new employee. The fix here is defining standard operating procedures (SOPs) and then training on them.
Variance *may* be the enemy
While individual service times are related to a single job, the downstream impact of variance in service times leads to outsized effects on other jobs.
We've all experienced it—you go to the grocery store to get a single item and the person ahead of you has 278 items of exotic, unlabeled produce, all of which they're paying for with expired coupons. In that case, even if you could be in and out in five minutes, you're going to be there for at least a decade.
This phenomenon is called head of line blocking, and it's the reason we have express lines at the grocery store, TSA PreCheck, and hot lanes on the highway. By separating out jobs by service time, we can make better use of our limited server resources.
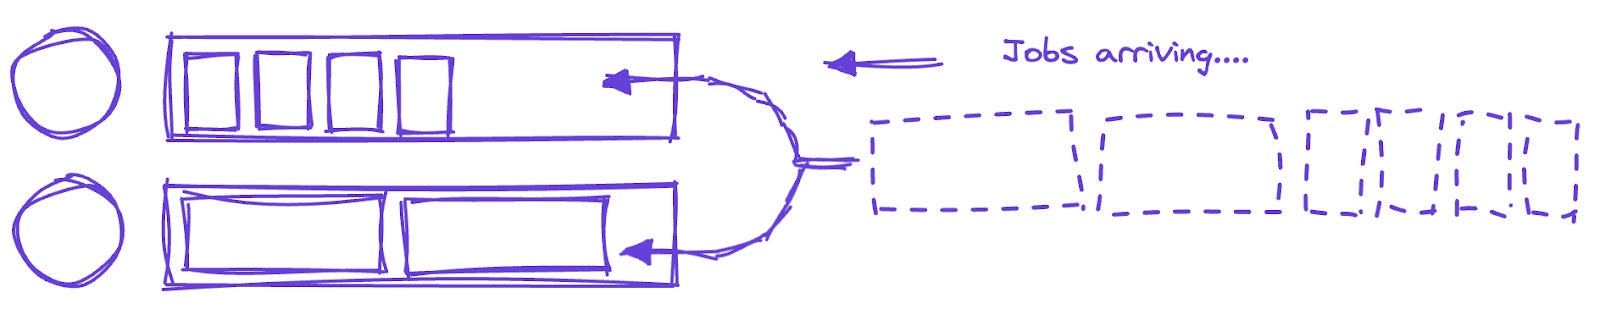
For example, in the diagram below, we show a two-server system with two types of jobs—one that takes five minutes, and one that takes 30 minutes. The job types arrive randomly. By happenstance, two of the 30 minute jobs arrive first, and then a set of five-minute jobs just after that:
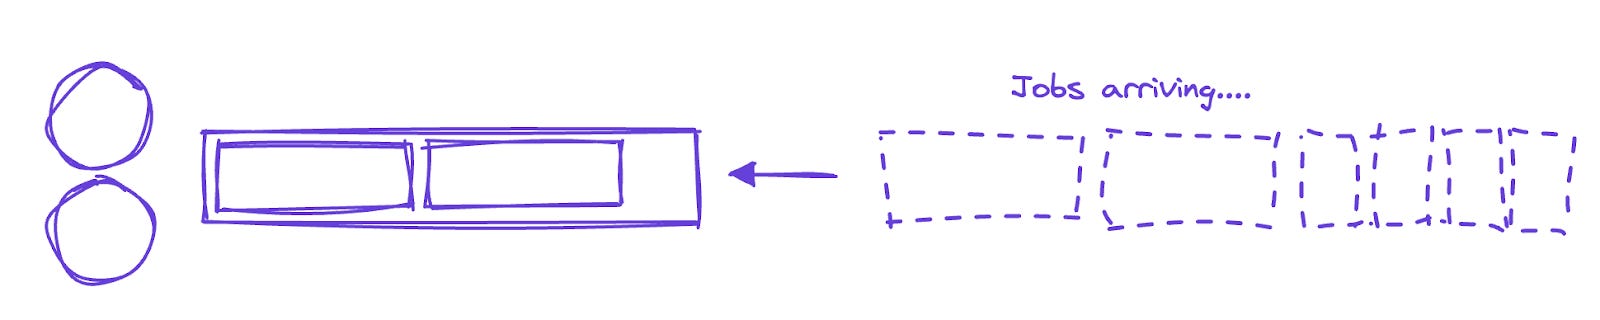
In this system the servers are sharing a single queue, so each server picks up a 30-minute job from the inbound stream, and the five-minute jobs have to sit around, like we do at the grocery store behind Mr. I-do-so-love-imported-durian. With this setup, we’ll process just two jobs in 30 minutes.
What if, on the other hand, we divided the jobs by service time, as we did in our taco example above? If we put in an express lane and have one server focus on quicker jobs while the other can take either quick jobs or slower moving ones, we could process five jobs in 30 minutes:
So we see that, even with the same arrival pattern of work and the same server resources, a system that minimizes service-time variance is more efficient than one that doesn’t.
Arrival time versus service time
We’ve been talking about service time, but you can minimize variance in arrival time as well. If you’ve seen a sign like this on the highway, you’ve seen the technique in action:
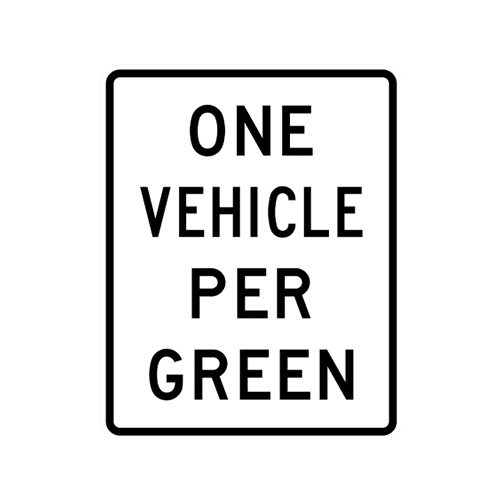
One car per green works well for a highway entrance ramp, but in IT, security operations, and other technology fields, it’s a bit harder to limit arrival rate directly. Imagine asking someone to resubmit a help desk ticket tomorrow, when you’re feeling less busy! In these cases, leaning into service time lets you speed things up—and keep everyone happy.
What does it all mean?
If your team is doing some sort of piece-work—IT trouble tickets, security alerts, customer requests, or taco assembly, for example—and they’re feeling overwhelmed, you may want to spend some time understanding what the patterns of work are. It’s possible that a combination of segmentation, SOP development, and training could make a huge difference for your efficiency— without the need to allocate more resources.
Matt Peters has spent the last 20+ years solving problems in networking and cybersecurity and building great teams to deliver those solutions. These days, he’s CEO and co-founder of Fixify, a company on a mission to change the face of IT by putting care at the center. (You can sign up to follow Fixify’s journey here.) When he’s not working, Matt’s coaching his kids’ softball teams or sharing his snacks with his adorable, mischievous dog, Luna. He has never missed an opportunity to make an obscure historical reference.